3D KIT USCT
!NEW! 3D USCT 3rd generation
Access to provided data and code
The following datasets are provided:
- 1: Gelatin phantom with four inclusions made from PVC (spheres of different size 8 mm to 22 mm)
- 2: Empty measurement with the same acquisition parameters as the gelatin phantom.
In order to utilize the data, we provide a MATLAB interface which has been updated for the USCT 3rd generation format. It can be accessed via GitHub repository at https://github.com/KIT-3DUSCT/3D-USCT-III-access-script. The source code is provided under 3-clause BSD-license.
The interface software enables retrieving A-scans, emitter and receiver positions, and additional meta data as e.g. ultrasound pulse information, temperature distribution in water. For questions and bug reports regarding the MATLAB interface please use the issue tracker or contact us via e-Mail.
License
The provided KIT USCT data can be accessed in zipped format via HTTP at this page. The data is freely available dual licensed under the 3-clause BSD-license and the “Open Data Commons Attribution License”, in accordance with the KIT recommendations for scientific data. Request to the licensee is the acknowledgment/attribution, following the scientific standards.
System description
The 3D USCT system 3rd generation (3D USCT III) has now a hemispherical 3D aperture (diameter approx. 35 cm) which is considerably larger than in 3D USCT II. This leads to a better illumination of a region of interest.
Approx. spherical wave fronts are generated by each emitter at 2.5 MHz center frequency (bandwidth 180% @ -10 dB). While one emitter sends the ultrasound wave, all receivers acquire the reflected and transmitted signals. Rotational and translational movement, so-called aperture positions, of the complete sensor system creates virtual positions of the ultrasound transducers. The provided datasets contain one aperture position only.
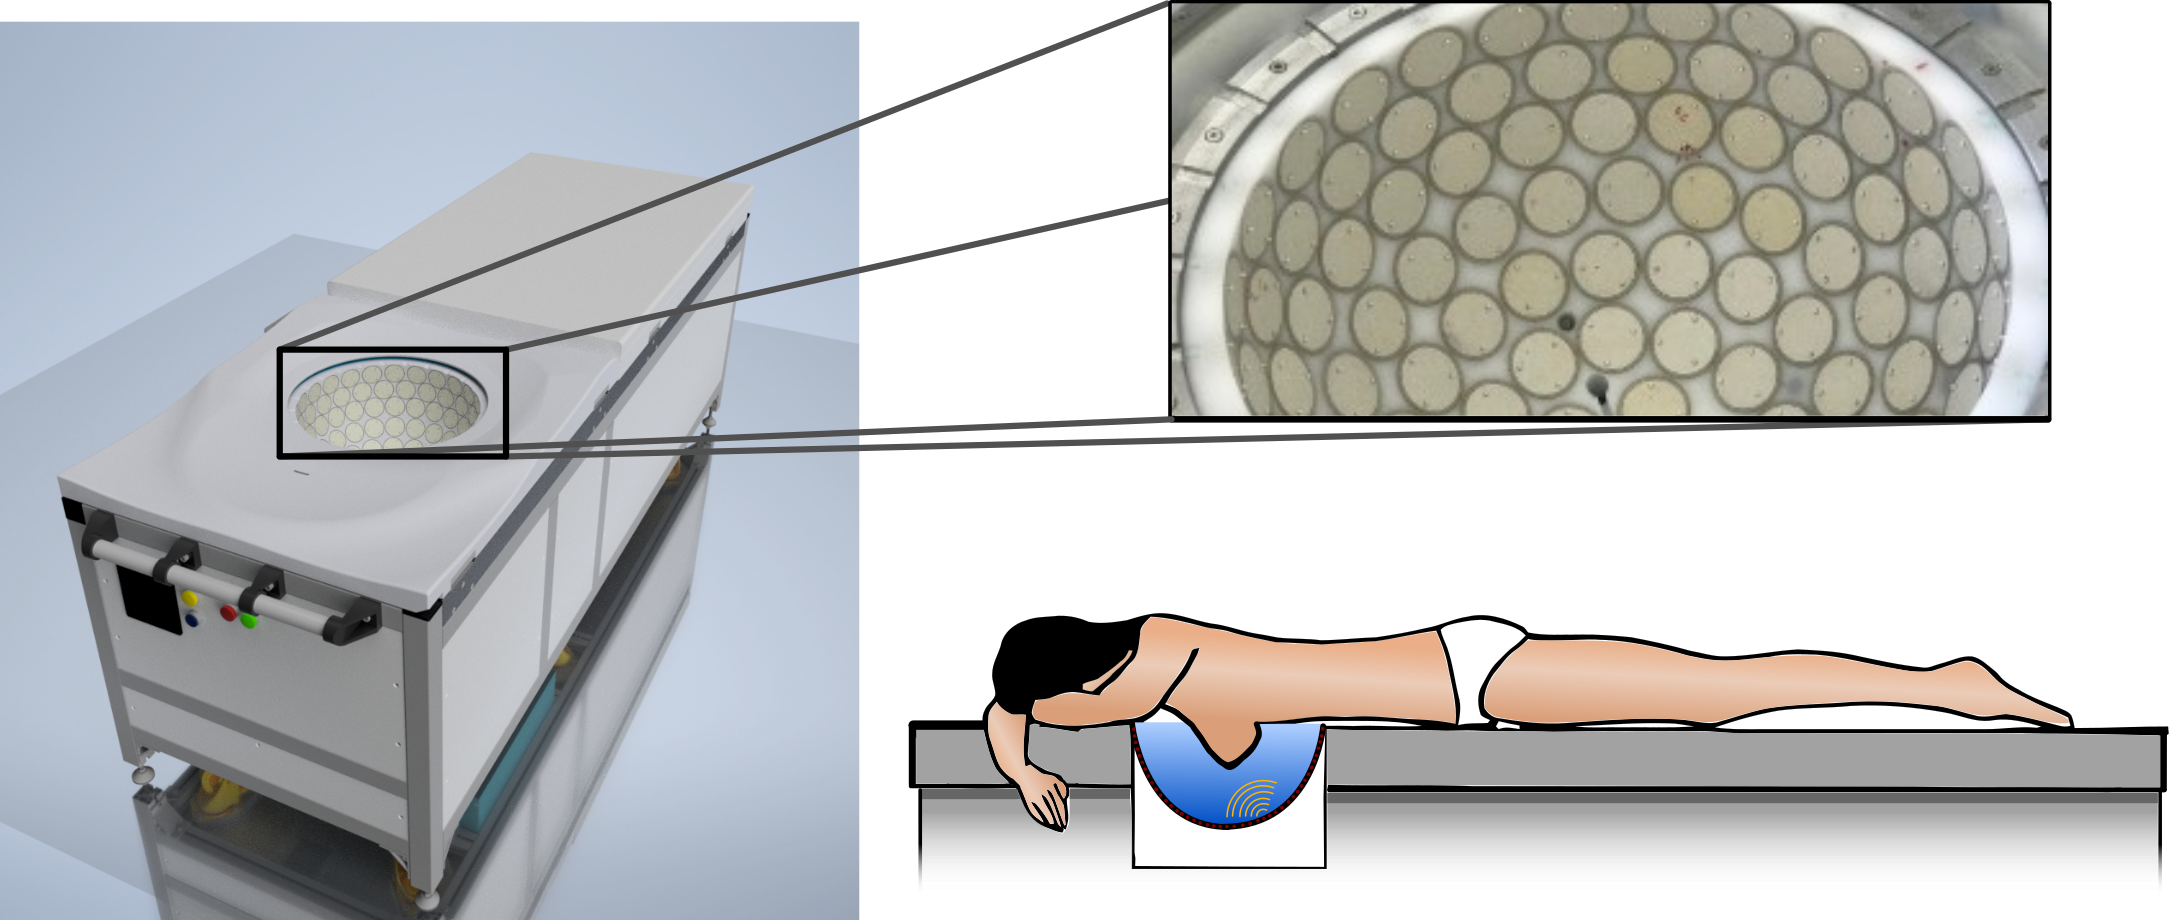
The system consists of 2304 individual transducers which are operated both as emitters and receivers. 18 transducers are grouped together including pre-amplifier and control electronics in so-called Transducer Array Systems (TAS), similar to USCT II. Each of the 128 TAS contains a temperature sensor for tracking the temperature distribution similar to USCT II. The transducers inside the TAS are pseudo-randomly positioned. The TAS are positioned with random rotation, leading to an overall pseudo-random distribution of transducers in the aperture.
The raw data does not contain the bandpass filtering applied in USCT II and thereby contains significantly more frequency content below 1.6 MHz. The emitters are excited with a coded excitation signal, e.g. frequency coded chirps can be applied to increase the signal-to-noise ratio of the data. Also the gain of the receiving channels is set individually based on a pre-measurement. The applied coded excitation, the individual gain, the temperature data and the spatial positions of the aperture are stored along with the A-scans for each measurement and can be used for signal preprocessing and image reconstruction.
3D USCT 2nd generation
Access to provided data and code
The following datasets are provided:
- 1: Gelatin phantom 1 (plastic cup with gelatin an water inclusions). (Total data amount: 16GB)
- 2: Empty measurement with the same parameters as the gelatin phantom 1. (16GB)
- 3: Organic phantom: olive embedded in turkey steak and gelatin. (33GB)
- 4: Empty measurement with the same parameters as the organic phantom. (33GB)
- 5: Gelatin phantom 2 with embedded metal thread. (Total data amount: 30GB)
- 6: Empty measurement with the same parameters as the gelatin phantom 2, 1 aperture position. (1.3GB)
(There is an SFTP transfer alternative:1, 2, 3, 4 download able conveniently on windows with filezilla Under Linux the multi-zip archive needs to be combined in a single ZIP first, before decompressing: e.g. zip -s 0 gelatine3.zip --out unsplit-gelatine.zip, unzip unsplit-gelatine.zip)
In order to utilize the data, we provide a MATLAB interface. It can be accessed via GitHub repository at KIT-3DUSCT/3DUSCT-data-access-script. Additionally the scripts are available as zip-file for download here (not recommended). The source code is provided under 3-clause BSD-license.
The interface software enables retrieving A-scans, emitter and receiver positions, and additional meta data as e.g. ultrasound pulse information, temperature distribution in water. For questions and bug reports regarding the MATLAB interface please use the GitHub issue tracker.
License
The provided KIT USCT data can be accessed in zipped format via HTTP at this page. The data is freely available dual licensed under the 3-clause BSD-license and the “Open Data Commons Attribution License”, in accordance with the KIT recommendations for scientific data. Request to the licensee is the acknowledgment/attribution, following the scientific standards.
System description
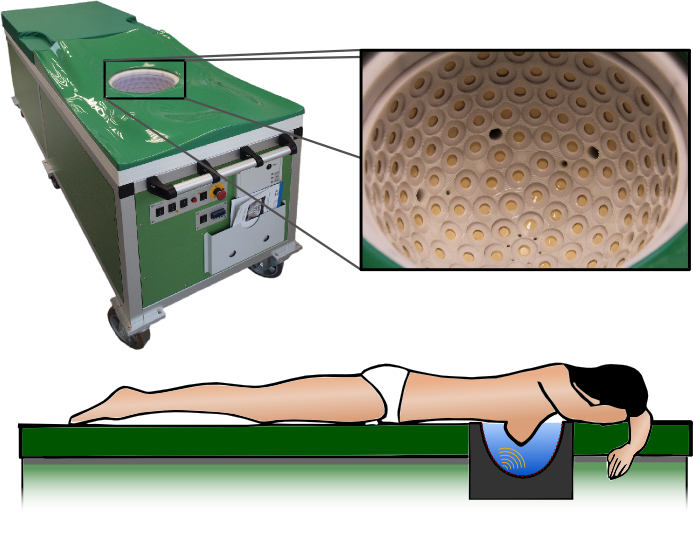
Figure 1: KIT 3D USCT: USCT with patient bed (left), transducer aperture (top right) and patient position (bottom right).
The KIT’s 3D Ultrasound Computer Tomography system 2nd generation (3D USCT II) is depicted in Figure 1. The device has a semi-ellipsoidal 3D aperture. Approx. spherical wave fronts are generated by each emitter at 2.5 MHz (bandwidth 1.5 MHz @ -6 dB). While one emitter sends the ultrasound wave, all receivers acquire the reflected and transmitted signals (Figure 2). The semi-elliptical aperture has a diameter of 26 cm and a height of 16 cm. Rotational and translational movement, so-called aperture positions, of the complete sensor system creates virtual positions of the ultrasound transducers.
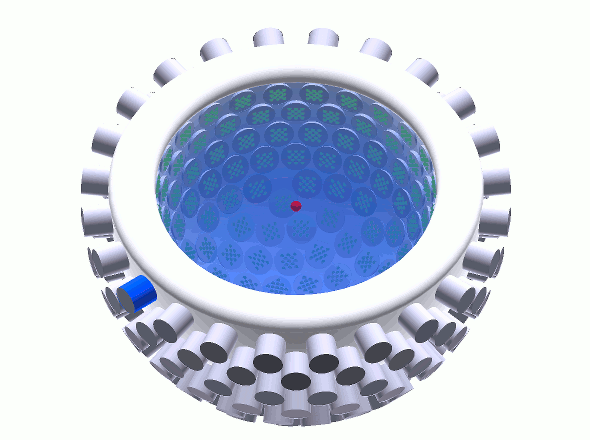
Figure 2: Simplified animation of the measurement principle: each sender emitts an approx. spherical wave into the USCT aperture. The wave interacts with the opject (in this case a point scatterer) and the reflected and transmitted signals are acquired by all receivers.
The 2041 individual transducers are either operated as emitter (628) or receiver (1413). The transducers have opening angles of 38.2° (standard deviation ±1.5°) at -6 dB. Four emitters and nine receivers are grouped together including pre-amplifier and control electronics in so-called Transducer Array Systems (TAS). Every TAS is an “Intelligent Sensor” as a micro controller is integrated, the micro controller orchestrates the communication with the outside DAQ system over a bus-system and internally to sub-systems like MUX, VGA, temperatures sensors etc. Also, every TAS can be pre-programmed with fhe future measurement procedure, which it will be than autonomously and parallely executed on receiving a broadcast trigger signal.
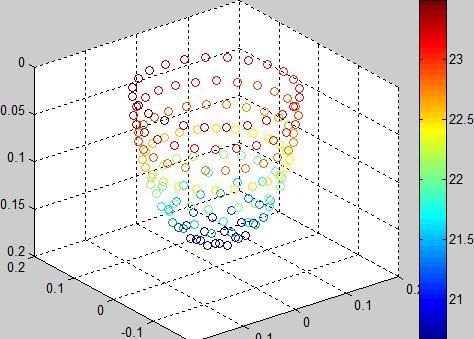
Figure 3: Temperature distribution in the 3D USCT per Transducer in degree Celsius. The monitoring happens fine-grained over time (~ per second) and space (~ 2cm on surface). Potentially significant temperature gradients in the water can be monitored autonomously and parallelly to the measurement.
Each of the 157 TAS contains a temperature measurement device for tracking the temperature distribution and shift at each TAS position during measurements with ~1s time resolution and ~ 0.2°C accuracy (super-resolution). Additionally, two calibrated PT100 temperature sensors are embedded in the measurement container to enable increased accuracy (~ 0.08°C).
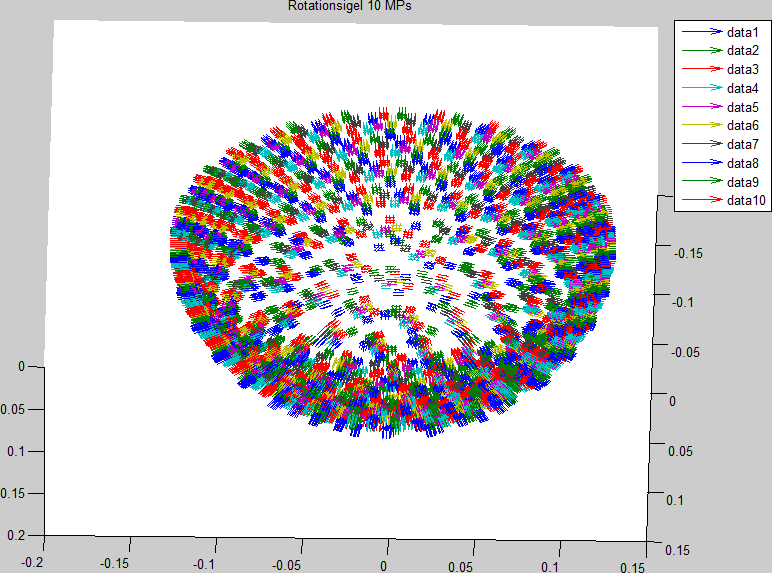
Figure 4: Virtual aperture of 3d-USCT with 10 positions. Color-coded are the individual virtual aperture positions, e.g. data 1 (dark blue) denotes as quivers the individual transducer positions with normal vector in virtual aperture position 1.
Additionally, the aperture density can be increased by rotation and lifting the physical aperture (lift dynamic 3cm, rotation range +-20°), forming a “virtual aperture”; see fig. 4 with an example with 10 virtual aperture positions. Goal of the rotation and lift position selection is a homogeneous but irregular distribution.
The data acquisition is carried out with an FPGA based system, which can store up to 80 GByte of A-scans. The digitalization is performed by 480 parallel channels (12 Bit @ 20 MHz), enabling data acquisition at one aperture position in approx. ten seconds. After digitization, the parallel data streams are processed as follows: The data streams are bandpass filtered (1.67 to 3.33 MHz @ -60 dB) and the data rate is reduced by a factor of 6, performing bandpass undersampling. The reduced data is then stored in the internal memory buffer. Using this approach, it is possible to store up to 47 data sets at different aperture positions in one data acquisition process.
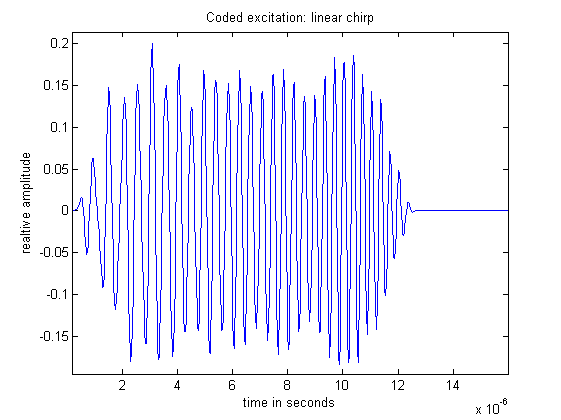
Figure 5: Linear Chirp between 1.66 and 3.33 MHz.
The emitters are excited with a coded excitation signal, e.g. frequency coded chirps can be applied to increase the signal-to-noise ratio of the data. Also the gain of the receiving channels is set individually based on a pre-measurement. The applied coded excitation, the individual gain, the temperature data and the spatial positions of the aperture are stored along with the A-scans for each measurement and can be used for signal preprocessing and image reconstruction.
The material (text and images) on this page are provided under Creative Commons license CC BY (OpenAccess).